InfoVis 2006—achievements and disappointments
Those of you who are familiar with my work know that I am an avid critic of business intelligence vendors that don’t understand data analysis and presentation, especially the variety that involves visual representations of information. I harangue and cajole in an effort to embarrass vendors into taking this critical aspect of business intelligence seriously. In several articles and blog posts, I’ve argued that business intelligence vendors should be familiar with the important work that has been and continues to be done by the information visualization research community and should incorporate this work into their products. Today, I’m going to focus my critical lens on the information visualization research community.
My work involves wearing several hats, all in the service of better business intelligence. One of those hats is that of a mediator between business intelligence software vendors and the information visualization research community. I try to help the vendors become familiar with the best research findings, so they can use them to improve their software, and I try to help the research community understand the needs of business people whose work involves making sense of information and presenting their findings to decision makers. I would also like to help the research community focus more of its work on real needs and on software that effectively addresses these needs.
I recently attended the InfoVis 2006 conference in Baltimore (produced by IEEE). This conference is the leading international venue where those involved in information visualization research can present their work. I attended the 2005 conference as well, which was my first time. The quality of my experience on both occasions was mixed.
I saw several presentations of excellent research that were built on a solid understanding of visual perception and cognition and followed a robust methodology. I also saw several that fell short on one or both counts. The failures surprised me, because most of these projects are conducted at major universities, where I would expect a thorough understanding of the field and careful research practices to be the norm.
Even when the research was done well, it wasn’t always worthwhile, for it often lacked potential application. I’ll admit that I’m strongly biased in this regard. I spend my days helping real people (mostly businesspeople) solve real problems in the real world. I believe that research projects should begin as a response to something that is really needed, a problem that requires a solution. Displaying treemaps with Voronoi tessellation in place of the usual rectangles (see below) might pose an interesting problem for software engineers, but is this a good enough reason to expend months of research and university funds, culminating in an event where several hundred people sit in a room and use their combined and significant brainpower to ogle the academic equivalent of a Hooters waitress? Cute, cool displays, in and of themselves, will not make the world a better place. In this yound and exciting field, there are plenty of projects that could.

I believe that every research project—certainly those that are awarded a spot in the InfoVis conference agenda—should be required to include the following two sections in the presentation:
- Why? Describe the problem that the project attempted to solve, not only abstractly, but also in concrete terms involving examples from the real world.
- Why still? Survey the other known attempts to solve this problem and describe what they lack that created the need for a better solution.
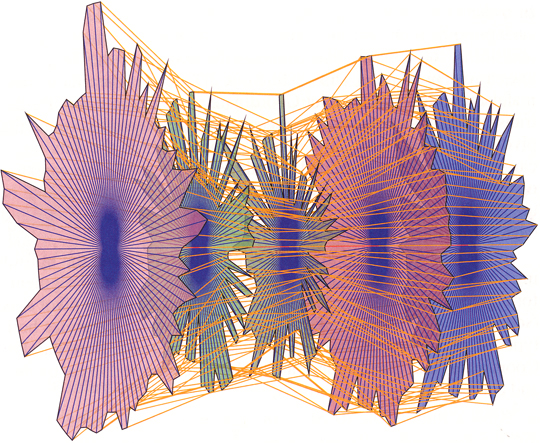
Beyond establishing why the project matters, presentations should also validate the merits of the solution in the form of tests on real people doing real work. For example, most of us who have used parallel coordinates to explore and analyze multivariate data would agree that meaningful patterns can be obscured in a clutter of lines, especially with large data sets. This is a real problem that can undermine the effectiveness of parallel coordinates displays. A real solution must surpass the transformation of parallel coordinates into 3-D star glyphs (see below), which are completely unreadable for what should have been obvious reasons. Supposedly, with this imaginative solution, problems with normal parallel coordinates can be “easily solved,” but nowhere in the presentation or paper was any empirical evidence for this claim provided.
If you’re going to claim the efficacy of your solution, especially if it seems perceptually incomprehensible, you had better be prepared to counter necessary objections with solid evidence. I say “necessary” objections, because research should be subjected to courteous but uncompromising peer review, and the assembled knowledge at InfoVis provides a venue for this that gets far too little expression. Every presentation should include:
- How do we know this works? Report of your empirical findings, resulting from tests of appropriate subjects performing real-world tasks.
We are privileged to be part of an exciting but still newly developing field. We must diligently critique the work and challenge one another to continuously improve. A panel at this year’s conference discussed the question: “Is information visualization science?” I believe the best work in the field is science, as it should be, but still too much of the work undermines our ability to speak of the field as a whole as science. This will change as the field matures. The question that I ask, however, is how quickly will it change? There’s a world out there that needs what we can discover and develop. Let’s focus today on what matters and what works.
Take care,
