Contents
Topical Index of All Stephen Few's Writings
Books
Articles
Whitepapers
Other Brief Publications
Books
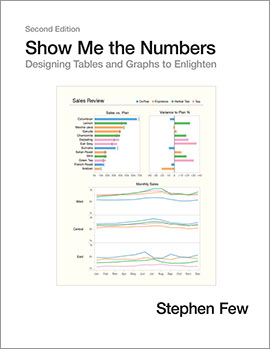
Show Me the Numbers, Second Edition, Stephen Few, $45.00 (U.S.), Analytics Press, 2012
Most presentations of quantitative information are poorly designed—painfully so, often to the point of misinformation. This problem, however, is rarely noticed and even more rarely addressed. We use tables and graphs to communicate quantitative information: the critical numbers that measure the health, identify the opportunities, and forecast the future of our organizations. Even the best information is useless, however, if its story is poorly told. This problem exists because almost no one has ever been trained to design tables and graphs for effective and efficient communication. Show Me the Numbers: Designing Tables and Graphs to Enlighten is the most accessible, practical, and comprehensive guide to table and graph design available.

Now You See It, Second Edition, Stephen Few, $49.00 (U.S.), Analytics Press, 2021
Now You See It does for visual data sensemaking what Show Me the Numbers does for graphical data presentation: it teaches simple, fundamental, and practical concepts, principles, and techniques that anyone can use—only this time they're exploring and making sense of information, not presenting it. These techniques rely primarily on something almost everyone has: vision. They use graphs to display data in ways that make meaningful patterns visible to reveal the stories that reside within. These techniques also involve interacting with data in particular ways to tease out relevant facts and their meanings.
Although some quantitative data sensemaking can only be done with sophisticated statistical techniques, most of the questions that organizations typically ask about their data can be answered using simple visualization techniques—techniques that can be learned by people with little or no statistical training. In other words, Now You See It is for the great majority of people whose jobs require them to make sense of quantitative information.
This second edition of the book now integrates the contents of Stephen Few's book Signal: Understanding What Matters in a World of Noise, which extends it into the realm of Statistical Process Control.

Information Dashboard Design, Second Edition, Stephen Few, $40.00 (U.S.), Analytics Press, 2013
Stephen Few exposes the common problems in dashboard design and describes its best practices in great detail and with a multitude of examples in this updated second edition. Dashboards have become a popular means to present critical information at a glance, yet few do so effectively. When properly designed to support rapid monitoring, dashboards engage the power of visual perception to communicate a dense collection of information efficiently and with exceptional clarity and that visual design skills that address the unique challenges of dashboards are not intuitive but rather learned. This book not only teaches how to design dashboards but also gives a deep understanding of the concepts—rooted in brain science—that explain the why behind the how.
The Data Loom, Stephen Few, $15.95 (U.S.), Analytics Press, May 15, 2019
Data, in and of itself, isn't valuable. It only becomes valuable when we make sense of it. Weaving data into understanding involves several distinct but complementary thinking skills. Foremost among them are critical thinking and scientific thinking. Until information professionals develop these capabilities, we will remain in the dark ages of data. If you're an information professional and have never been trained to think critically and scientifically with data, this book will set your feet on the path that will lead to an Information Age worthy of the name.

Big Data, Big Dupe, Stephen Few, $11.95 (U.S.), Analytics Press, February 1, 2018
Big Data, Big Dupe is a little book about a big bunch of nonsense. The story of David and Goliath inspires us to hope that something little, when armed with truth, can topple something big that is a lie. This is the author's hope. While others have written about the dangers of Big Data, Stephen Few reveals the deceit that belies its illusory nature. If "data is the new oil," Big Data is the new snake oil. It isn't real. It's a marketing campaign that has distracted us for years from the real and important work of deriving value from data.
Articles by Stephen Few and Guest Authors
Visual Business Intelligence Newsletter
Heatmaps: to Bin or Not to Bin? Oct/Nov/Dec 2017
Journey to Zvinca: The Making of a New Chart Jul/Aug/Sep 2017
The DataVis Jitterbug: Let's Improve an Old Dance Apr/May/Jun 2017
Data Visualization Effectiveness Profile Jan/Feb/Mar 2017
The Visual Perception of Variation in Data Displays Oct/Nov/Dec 2016
Bar Widths and the Spaces in Between Jul/Aug/Sep 2016
Expressing Proportions Apr/May/Jun 2016
Visualizing Wide-Variation Data Nick Desbarats, Jan/Feb/Mar 2016
Information Visualization Research as Pseudo-Science Oct/Nov/Dec 2015
A Course of Study in Analytical Thinking Jul/Aug/Sep 2015
What Do Data Analysts Most Need from Their Tools? Apr/May/Jun 2015
Displaying Missing Values and Incomplete Periods in Time Series Jan/Feb/Mar 2015
Display Platforms for Quantitative Information Oct/Nov/Dec 2014
Distribution Displays, Conventional and Potential Jul/Aug/Sep 2014
Displaying Change Between Two Points in Time Apr/May/Jun 2014
Are Mosaic Plots Worthwhile? Jan/Feb/Mar 2014
Variation and Its Discontents Oct/Nov/Dec 2013
Wrapping Graphs to Extend Their Limits Jul/Aug/Sep 2013
Building Insight with Bricks Apr/May/Jun 2013
Introducing Bandlines Jan/Feb/Mar 2013
Best Practices for Scaling Sparklines in Dashboards Oct/Nov/Dec 2012
Big Data, Big Ruse Jul/Aug/Sep 2012
Criteria for Evaluating Visual EDA Tools Apr/May/Jun 2012
Use-Based Types of Quantitative Display Jan/Feb/Mar 2012
Benefitting InfoVis with Visual Difficulties? Oct/Nov/Dec 2011
Exploratory Vistas: Ways to Become Acquainted with a Data Set for the First Time Jul/Aug/Sep 2011
The Chartjunk Debate: A Close Examination of Recent Findings Apr/May/Jun 2011
Quantitative Displays for Combining Time-Series and Part-to-Whole Relationships Jan/Feb/Mar 2011
Unit Charts Are For Kids Oct/Nov/Dec 2010
Coordinated Highlighting in Context Jul/Aug/Sep 2010
Our Irresistible Fascination with All Things Circular Mar/Apr/May 2010
Quantitative Literacy Across the Curriculum Naomi and Joyce Robbins Feb 2010
Information Visualization, Design, and the Arts Jan 2010
Fundamental Differences in Analytical Tools Sep/Oct 2009
Statistical Narrative: Telling Compelling Stories with Numbers Jul/Aug 2009
Cartographic Malpractice May/Jun 2009
Introduction to Geographical Data Visualization Mar/Apr 2009
Sometimes We Must Raise Our Voices Jan/Feb 2009
Line Graphs and Irregular Intervals—An Incompatible Partnership Nov/Dec 2008
Solutions to the Problem of Over-Plotting in Graphs Sep/Oct 2008
What Ordinary People Need Most from Information Visualization Today Aug 2008
Time on the Horizon Jun/Jul 2008
What's Up with Tag Clouds? Marti A. Hearst, May 2008
Inflation Matters Jonathan Koomey, Apr 2008
Dual-Scaled Axes in Graphs Mar 2008
Practical Rules for Using Color in Charts Feb 2008
Introduction to Cycle Plots Naomi Robbins, Jan 2008
The Role of Software and the Importance of Thoughtful Defaults Dec 2007
Infovis as Seen by the World Out There: 2007 in Review Oct/Nov 2007
Visualizing Change: An Innovation in Time-Series Analysis Sep 2007
Save the Pies for Dessert Jul/Aug 2007
FYI Visual: The Story of a Product that was Built on a Fault Jun 2007
The Graph Design I.Q. Test May 2007
Intelligent Design: Introducing Tableau 3.0 Apr 2007
Dashboard Confusion Revisited Mar 2007
Sticky Stories Told with Numbers Feb 2007
Information Graphics: A Celebration and Recollection Aaron Marcus, Feb 2007
Pervasive Hurdles to Effective Dashboard Design Jan 2007
Data Visualizations that Set the Bar Where It Ought to Be Dec 2006
Dashboard Design for Rich and Rapid Monitoring Nov 2006
Business Intelligence Network (B-EYE-NETWORK)
Multivariate Analysis Using Heatmaps Oct 2006
Simple Displays of Complex Quantitative Relationships Oct 2006
Multivariate Analysis Using Parallel Coordinates Sep 2006
Graph Designs for Reviewing Transactions... Sep 2006
Review of Beautiful Evidence by Edward Tufte Aug 2006
Graph Designs for Assessing Budget Performance Aug 2006
An Introduction to Visual Multivariate Analysis Jul 2006
TableLens Ramana Rao, Jul 2006
Software Support for Immersive Business Intelligence Jun 2006
Customer Flashcards Chris and Zach Gemignani, Jun 2006
Excel's New Charting Engine May 2006
Hard Facts May 2006
The Surest Path to Visual Discovery Apr 2006
Discovering BI Using Treemap Visualizations Ben Shneiderman, Apr 2006
The Power of Visual Business Intelligence Mar 2006
Dot Plots: A Useful Alternative to Bar Charts Naomi Robbins, Mar 2006
Recommendations for Your Data Visualization Bookshelf Feb 2006
Best Practices for Understanding Data Jonathan Koomey, Feb 2006
Rules for Encoding Values in Graphs Jan 2006
Choosing Colors for Data Visualization Maureen Stone, Jan 2006
Discovering the Source of Business Intelligence Within Dec 2005
DM Review
Uses and Misuses of Color Nov 2005
Creative Visualization: Best in Show Oct 2005
Intelligent Dashboard Design Sep 2005
Boxes of Insight Aug 2005
Viewing Multidimensional Data Through Time Jul 2005
Graphic Grist for the Mill Jun 2005
Keep Radar Graphs Below the Radar — Far Below May 2005
Quantitative vs. Categorical Data April 2005
Dashboard Design: Taking a Metaphor Too Far Mar 2005
Grid Lines in Graphs are Rarely Useful Feb 2005
Bad Graphs: The Stealth Virus Jan 2005
Intelligent Enterprise
Put to the Test: Tableau 2.0 Aug 2006
Advizor Solutions Invites You to a Double Wedding Jan 2006
Visual Detraction Oct 2005
Data Analysis at the Speed of Thought Apr 2005
Elegance through Simplicity Oct 2004
Selecting the Right Graph for Your Message Sep 2004
Tapping the Power of Visual Perception Sep 2004
Common Mistakes in Data Presentation Aug 2004
The Information Cannot Speak for Itself Jul 2004
Dashboard Confusion Mar 2004
Whitepapers
With Dashboards, Formatting and Layout Definitely Matter Corda
Three Blind Men and an Elephant Tableau
Dashboard Design for Real-Time Situation Awareness Inova Solutions
Improve Your Vision and Expand Your Mind with Visual Analytics Tableau
Data Visualization — Past, Present, and Future Cognos
Visual Pattern Recognition Cognos
Visual Communication Cognos
Rich Data, Poor Data — Designing Dashboards to Inform Noetix
Common Pitfalls in Dashboard Design ProClarity
Visual and Interactive Analytics Spotfire
Effectively Communicating Numbers ProClarity
Other Brief Publications
Why Most Dashboards Fail
Graph Selection Matrix
Bullet Graph Design Specification
Dashboard Design Requirements Questionnaire
Potential InfoVis Research Projects List
Infographics and the Brain: Designing Graphics to Inform Presented at Malofiej 19
Data Visualization for Human Perception
Message to Executives about Data Presentation
Designing Effective Tables and Graphs
Practical Problem Solving Jonathan Koomey